Optimise your performance with exceptional reporting
Our online measurement portal runs on most modern browsers and requires no special software to be installed. Access the live data from anywhere in the world through an internet-connected device.
Water data is very different from electricity data and as such several specific reports have been developed. Basic reporting includes consumption graphs as follows:
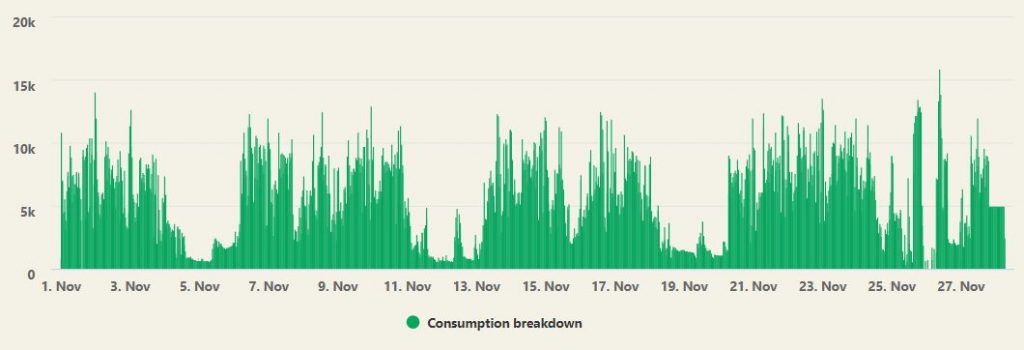
Figure 1. Consumption breakdown
This report is typically used to track water consumption over time. A manager could use this to target times of high consumption, or to compare water consumption to activities on site.
More advanced reporting include tree-views, showing relationships of sub-meters to each other:
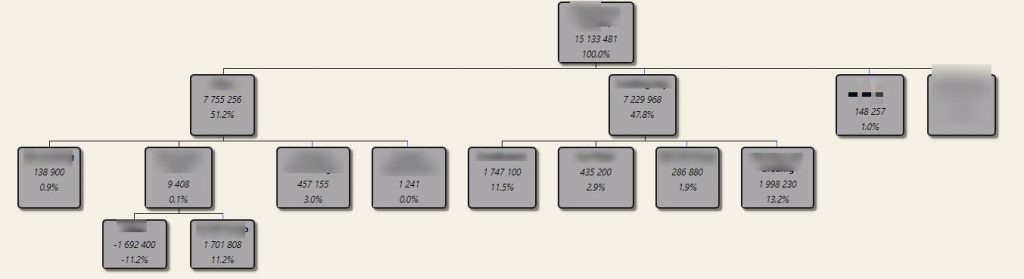
Figure 2. Tree-view of water consumption
For sites with multiple meters installed, this report provides a clear view of where your water is going. This report therefore allows you to identify significant water users and act accordingly
Learn more about water measurement